
ABC analysis is a method in inventory management aimed at assessing the significance of inventory items to a business. It involves evaluating items based on factors such as demand, cost, and risk data, after which inventory managers classify them into different categories. This classification aids business leaders in understanding the crucial products or services vital for their organization’s financial success.
The top-priority stock-keeping units (SKUs), determined by factors like sales volume or profitability, are designated as “Class A” items, followed by Class B and then Class C for less critical items. Some companies might opt for a more nuanced classification system, extending beyond the traditional A-C categorization, such as A-F.
While ABC analysis in inventory management focuses on prioritizing inventory items, ABC analysis in cost accounting, also known as activity-based costing, serves a different purpose. In cost accounting, activity-based costing is utilized in manufacturing to allocate indirect or overhead costs, like utilities or salaries, to products and services.
ABC Analysis and the Pareto Principle
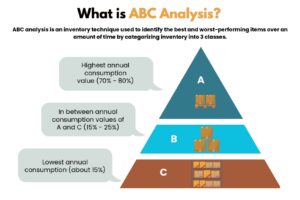
The Pareto Principle suggests that a significant portion of outcomes stem from a minority of efforts or factors within a system, typically around 20%. Applying Pareto’s 80/20 principle, ABC analysis pinpoints the top 20% of products that contribute roughly 80% of the overall value.
Consequently, many businesses possess a limited number of “A” items, followed by a slightly larger cluster of “B” products, and a substantial grouping of “C” goods, which represent the majority of items.
Classes in ABC Inventory Management
| Type | Importance | Percentage of Total Inventory | Annual Consumption Value | Controls | Records |
| Class A | High Dollar Value | 10% – 20% | 70% – 80% | Tight | High Accuracy |
| Class B | Medium Dollar Value | 30% | 15% – 20% | Medium | Good |
| Class C | Low Dollar Value | 50% | 5% | Basic | Minimal |
While the Pareto Principle may not always be perfectly accurate, analysis often reveals an approximate 80/20 distribution of value. ABC analysis effectively pinpoints the core revenue drivers of a business with minimal effort.
Calculation of ABC Inventory Analysis
To conduct ABC inventory analysis, multiply the annual sales of each item by its cost. This calculation highlights which items are high priority and which ones generate low profits, enabling you to allocate human and capital resources more effectively.
Here’s the formula for ABC inventory analysis:
(Number of items sold annually) x (Cost per item) = (Usage value per product annually)
You can perform a basic ABC inventory analysis using Microsoft Excel. Arrange each product or resource in descending order based on its annual usage value. Calculate the total value of all items. Then, determine the thresholds for the A, B, and C categories, and assign each item to its corresponding group. The items with the highest value warrant the most attention from management.
How ABC Analysis Simplifies Work for Inventory Managers
Inventory managers continually seek methods to enhance pricing, quality, and operational efficiency. With this objective in mind, they often employ the ABC technique, also known as the “always better control” method. This approach enables them to concentrate their resources primarily on Class A inventory items while allocating fewer resources to B and C class products. For instance, inventory managers prioritize checking purchase orders for Class A items, which yield the highest revenue.
Video: ABC Analysis in Inventory Management
Why Use ABC Analysis?
Utilizing ABC analysis in inventory management enhances control over working capital expenses. Insights obtained from this analysis facilitate the reduction of obsolete inventory and have the potential to increase the inventory turnover rate, indicating how frequently a business replenishes items after selling them.
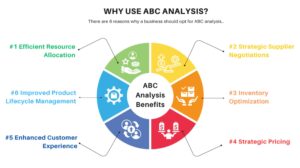
ABC Analysis Benefits
Enhanced Inventory Management: Through thorough analysis, identify high-demand products to optimize warehouse space allocation, ensuring adequate stock levels for profitable items while minimizing inventory of lower-demand ones.
Refined Sales Projection: By meticulously monitoring data on popular products, refine sales forecasts for informed inventory management, potentially boosting company revenue by setting optimal inventory levels and prices.
Optimized Pricing Strategy: Capitalize on increased demand by adjusting prices accordingly, enhancing profitability for specific items experiencing heightened sales.
Strategic Supplier Negotiations: Prioritize negotiating favorable terms for high-revenue Class A items, exploring various avenues for cost savings or added value if direct cost reductions are not feasible.
Efficient Resource Allocation: Continuously evaluate resource allocation based on ABC analysis to align with shifting customer demand, optimizing personnel, time, and space allocation.
Enhanced Customer Experience: Tailor service levels based on profitability, focusing on high-margin items to improve overall customer satisfaction.
Improved Product Lifecycle Management: Gain insights into product lifecycle stages to accurately forecast demand and adjust inventory levels accordingly.
Effective Management of High-Value Inventory: Maintain healthy stock levels and closely monitor demand for Class A items to ensure sustained company success.
Optimized Stock Turnover: Maintain appropriate stock turnover rates through meticulous inventory control and data analysis.
Reduced Storage Costs: Optimize inventory proportions for each class (A, B, C) to minimize carrying costs associated with excess inventory.
Streamlined Supply Chain Operations: Utilize ABC analysis to streamline supplier relationships, potentially consolidating or transitioning to a single source to reduce costs and simplify operations.
The Limitations of ABC Analysis
Despite its numerous advantages in inventory maintenance and management, ABC analysis doesn’t offer a universal solution applicable to all organizations. Each organization possesses distinct customer demand patterns, classification systems, and other factors that influence the relevance of ABC analysis.
The drawbacks of ABC analysis arise from two main factors: its focus on the monetary value of inventory and the considerable time and effort required for its implementation. Below are additional challenges:
Instability in Parameters: Up to 50% of items are reallocated to a new category each quarter or year due to ABC analysis. Often, companies become aware of these changes only when demand issues arise, necessitating reassessment that consumes valuable time and risks compromising customer satisfaction.
Limited Consideration of Patterns: The conventional ABC method overlooks factors such as new product launches or seasonal variations in products. For instance, a newly introduced product may initially have low sales due to its lack of purchase history. This static perspective of demand in ABC analysis can lead to inventory inefficiencies whenever there are shifts or uncertainties in demand.
Insufficient Information Extraction: The classification information provided by ABC may not offer all the necessary statistical data or detailed insights required for making strategic management decisions.
High Resource Consumption: The tendency to overly focus on trivial matters, known as bikeshedding, can unfortunately occur with ABC analysis. Its simplicity may lead staff to introduce their opinions or request modifications, turning ABC analysis into a resource-intensive process rather than a time-saving tool.
Blindness to Value: ABC analysis assesses product importance based on usage frequency, which may not align with certain items’ actual significance. For instance, a retail display item may have infrequent sales but attract numerous customers, driving sales of other products. Similarly, in aerospace, a specific plane part may have low usage frequency and market value but hold critical safety functions.
System Incompatibility: ABC inventory analysis clashes with traditional costing systems and falls short of meeting generally accepted accounting principles (GAAP) requirements. Implementing multiple costing systems can escalate labor costs and inefficiencies.
Issues with Under or Overstocking: One drawback of ABC analysis is its reliance on dollar values rather than the volume of inventory turnover, which can lead to the risk of shortages of Class B or C items. Conversely, overstocking of lower-class items may occur if reordering happens without regular reviews.
Risk of Loss: Despite B and C items having lower values compared to Class A products, they still hold value. ABC analysis limitations include the constant risk of excess inventory becoming obsolete or damaged, especially when inventory is left uncounted or unmonitored, increasing vulnerability to theft.
Necessity of Standardization: Successful implementation of the ABC method hinges on the standardization of materials for every item, encompassing naming conventions, storage procedures, and consistent evaluation and monitoring practices.
Subjective Categorization: The absence of predetermined boundaries or universally agreed-upon standards for each category results in goods classification relying heavily on managerial discretion, making the process somewhat subjective.
Limitations Based on Business Type: ABC analysis may not apply to businesses with uniform annual consumption values across inventory items of the same type. For example, companies selling identical versions of items like candy, nails, or socks may struggle to categorize stock according to the Pareto Principle.
Resource Intensiveness: Companies with a large inventory item count may need to allocate additional personnel or invest in specialized equipment to effectively manage inventory using ABC categorization.

The Process of ABC Analysis
To conduct a comprehensive ABC analysis, start by defining the objective you aim to achieve. Once established, gather the necessary data for item classification. Once the categories are set, closely monitor and base decisions on the resultant data.
Here’s a breakdown of the steps involved in performing an ABC analysis:
Define the Objective: Determine whether your goal is to reduce procurement expenses or enhance cash flow by optimizing inventory levels of key items based on customer sales or production needs.
Gather Data: The primary data to collect typically includes the annual expenditure on each item, represented in raw purchase dollars. If feasible, you can also compile weighted costs, incorporating factors like gross profit margin, ordering costs, and carrying costs.
Arrange in Descending Order of Impact: Utilize the ABC analysis formula to rank each inventory item based on its cost, arranging them in descending order of impact, from highest to lowest.
Determine the Sales Impact: Calculate the sales impact of each inventory item as a percentage by dividing its annual cost by the total expenditure on all items. This percentage serves as a basis for comparing items in the list. Here’s the formula:
% impact = (annual item cost) / (total expenditure on all items) x 100
Classify Items into Purchase Categories: After establishing the categories, focus on activities such as renegotiating contracts, consolidating vendors, adjusting strategic sourcing approaches, or implementing e-procurement. These changes can lead to significant savings or ensure the availability of Class A items in stock. It’s advisable to adopt a comprehensive perspective rather than strictly adhering to the 80/20 rule.
Evaluate Categories: Once the classifications and strategic cost management strategies are defined, schedule regular reviews to assess the effectiveness or shortcomings of decisions.
Best Practices for ABC Analysis
Best practices for ABC analysis emphasize consistency, sales monitoring, and vigilance regarding events that could impact stock levels or value. Leveraging technology for inventory management is a recommended approach that streamlines the entire process.
Implement the following best practices when conducting an ABC analysis:
Simplify Classifications: Classify items based on their frequency of movement within your organization. Items with high turnover rates are more susceptible to stockouts. Alternatively, you can categorize items according to their value or gross profit margin. Class A would comprise the highest-priced items, Class B the moderately priced ones, and Class C the least expensive ones.
Simultaneously Determine Service and Labor Levels: Set service levels based on the class of each item. Class A products should have the highest service level targets, while those in the lowest class should have the lowest targets. For example, managers might allocate 10 hours to review 100 Class A items and the same time to review 10,000 Class C items. Schedule cycle counting according to classification, ensuring more frequent counting for Class A items (which have the most significant impact on sales performance) than for Class B and C items.
Segment KPIs by Class: Establish distinct key performance indicators (KPIs), generate corresponding reports, and develop dashboards for each class.
Conduct Performance Evaluations: Perform performance evaluations during comprehensive inventory maintenance or according to schedules and protocols tied to ABC classifications.
Assess Excess Inventory: Evaluate whether your current surplus inventory levels align with your company’s needs. In today’s global, just-in-time economy, excessive inventory may entail unnecessary risks and holding costs. If retaining this inventory is justified, ensure it is categorized correctly.
Implement Cross-Location Management: Supply chain managers should have the capability to oversee inventory across multiple physical locations.
Track Inventory in Transit: Monitor the duration between the shipment and receipt dates when inventory moves between locations. Such audits help maintain accurate inventory records and enable prompt identification of damage or loss.
Strategically Reclassify: Maintain flexibility in the timing and methodology of inventory reclassification. Periodic reclassification may be necessary due to market fluctuations, shifts in customer demographics or purchasing behaviors, the emergence of new popular products, or changes in key performance indicators (KPIs) or business strategies.
Consider Sales and Inventory in Conjunction: Acknowledge the correlation between sales and inventory levels. With increasing sales, inventory turnover rises, necessitating restocking according to anticipated schedules. Conversely, market downturns may prompt a reassessment of item classifications and stock levels. Additionally, review pricing and promotional strategies based on item classification.
Harness Technology and Utilize Data: Inventory managers employ automated systems to streamline replenishment processes, identify surges in demand, and prevent fulfillment issues. Utilize data to effectively manage lead times and forecast demand.

Utilizing ABC Analysis for Cycle Counting
Cycle counts entail periodic inventory checks conducted throughout the business year. ABC analysis ensures more frequent counting of critical, high-volume items.
With cycle counting, the accuracy of the inventory records in the warehouse management system can be cross-checked and verified. Scheduled cycle counts can be organized by classification, ensuring that Class A items—those with the most significant impact on sales performance—are counted more regularly than Class B and C items.
How to Implement ABC Inventory Management
To effectively implement ABC inventory management, it’s crucial to evaluate its suitability for your business beforehand. Avoid making assumptions by posing critical questions. Upon deciding to proceed, undertake any essential preparations to facilitate a seamless execution.
Utilize the following questionnaire to gauge your readiness for ABC analysis implementation. If you answer “No” to any questions, further preparation is necessary before undertaking an ABC analysis:
| Issue | Query | Yes/No |
| Gathering Information | Is there reliable, accessible and item-specific demand and cost data? | |
| Business Case | Have you quantified the advantages of implementation and operation using SMART targets and goals? Are the benefits greater than the associated risks? | |
| Impact | Have you evaluated the impact of transitioning to ABC analysis? | |
| Timing | Have you set a feasible timeline for implementation? | |
| System Consideration | Are there established processes and systems to support the efficient functioning of the ABC method? | |
| KPIs | Have you identified key performance indicators (KPIs) to monitor cost savings? |
Use Cases for ABC Analysis in Various Industries
Almost every business type stands to gain from employing ABC analysis, with companies worldwide leveraging this method to streamline processes and enhance profitability.
So, how do businesses across various industries utilize the 80/20 ratio and ABC analysis?
Retail: Retail establishments utilize ABC analysis to pinpoint the most lucrative products within their inventory. This data guides promotional efforts across retail outlets and ensures adequate stock availability.
Automotive: The ABC method empowers automotive manufacturers to assess the efficiency of line workers, glean insights into resource allocation, and identify high-performing equipment. Additionally, inventory management offers valuable insights into necessary raw materials and facilitates negotiation of contracts with suppliers.
Warehousing: Within warehouse operations, ABC analysis and segmentation enable inventory controllers to optimize the management of high-value inventory, including determining appropriate levels of safety stock to prevent stockouts. Data-driven insights also prompt reassessment of product offerings and phasing out obsolete goods.
Manufacturing: In manufacturing environments, ABC analysis enhances profit margins by identifying the top 20% of revenue-generating products. This analysis informs decisions regarding required parts, materials, and associated margins, enabling prioritization of resources to maximize impact.
ABC Analysis with PALMS™ Smart WMS
PALMS™ Smart WMS can be configured to run ABC analysis on a periodic basis and optimize inventory management. In PALMS™ Smart WMS, it can also be run in conjunction with XYZ analysis, which categorizes inventory based on demand variability. The resulting ABC/XYZ analysis values can be used for demand planning and forecasting, effective slotting to optimize storage, and warehouse throughput. Warehouse managers are able to avoid the tedious task of manually running ABC classification, and can use the WMS to configure all the requirements across multiple warehouses. The results based on the configured rules largely depict the actual scenario.
With PALMS™ Smart WMS, you can usher in a digital transformation in your warehouses, gaining greater visibility and improving overall efficiency. Speak to our experts today to learn more!
23/04/24