Supply Chain Analytics and Their Importance
Supply chain analytics or metrics are simple tools/calculations used in the business to measure, predict, determine and improve key areas of the business to maximize profits and reduce the time involved. Let’s take a short look on the basis.
What is a Supply Chain?
A Supply Chain is nothing but the entire process of procurement of raw material – to manufacturing – to storage of the processed material- to distribution of the finished product to the vendors (Sometimes the end customers)
In these rapidly evolving times with the explosive impact of e-commerce (Online Shopping) on traditional (Instore Shopping) whereabout 40 percent of shopping happens online as compared to 100 percent instore shopping as it used to a decade ago, Supply Chains have modernized themselves with the state-of-the-art technologies to ensure accurate “production to delivery times”, forecasting for future procurement and finally – seamless and flawless integration with multiple payment channels.
Like any other business, Supply Chains too face multiple challenges which vary on countless factors. Likewise, Successful Supply Chains overcome these challenges by analyzing their pain points and identifying shortcomings in their processes which is exactly where Supply Chain Analytics come in.
Supply Chain Analytics or Metrics are nothing but data-driven techniques that could Vastly transform the way Supply Chains – define, manage and most importantly improve their Business.
Supply Chain analytics are based on multiple factors also known as KPIs (Key Performance Indicator) or KPAs (Key Performance Areas)
Let’s take a quick look on Major KPIs that Supply Chains consider most important:
1) Productivity / Capacity utilization.

Production – A simple measure of the total amount of goods produced in a given unit time ( days, weeks, , months etc. ) vs the maximum possible output of the goods that can be produced in the same given unit of time.
- Manpower utilization– “Happy employees make happy customers!” If your turnover is less than optimal, it is time to do some analysis on why it is so and what can be done to achieve maximum efficiency
- Equipment utilization–This KPI simply measures the overall effectiveness of a part of or the whole production line. Availability x Performance x Quality
- Cycle time – A combined measure of Manpower and Equipment utilization. Or simply put, the TIME TAKEN TO COMPLETE ONE CYCLE OF THE ENTIRE PRODUCTION PROCESS.
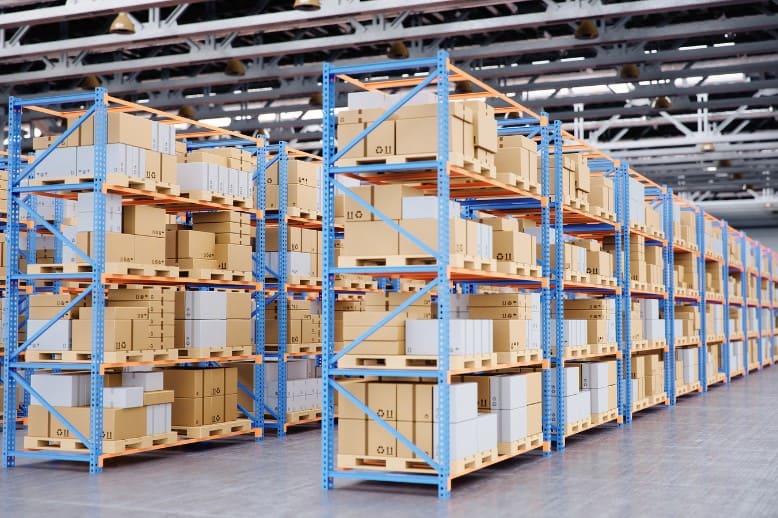
2) Storage
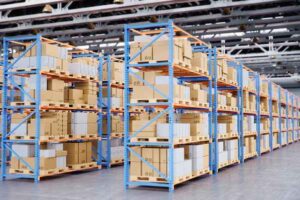
- Storage Efficiency– Haphazard manners of unplanned and / or unclassified ways and methods to store goods does become a highly toxic element to a supply chain. It completely disrupts the optimal ratio of TOTAL SPACE AVAILABLE FOR STORAGE VS TOTAL SPACE UTILISED. This is another key metric or KPI that Warehouse Managers must focus on. A good Warehouse Management System helps tackle this hurdle with utmost ease.
- Cost – Total cost incurred in WH operations vs value of goods stored in that warehouse
- Inventory accuracy – Physical inventory vs electronically recorded inventory
- Damages – Ratio of damaged products vs total products handled
- Throughput / Warehouse dispatching – The accuracy or the ability of the warehouse management system and or the team will determine the speed and accuracy which with the stored goods are – A. Located within the warehouse for picking and B. brought to the right dispatch area well before they are to be shipped.

3) Fleet utilization
The delivery trucks / vans just like the equipment in the warehouse can operate at an optimum efficiency if the delivery planning is flawless. This KPI is a simple measure of trucks that have delivered goods with Full load vs the total amount of trucks that have been used for deliveries.
A few sub-sections of transportation may include minor but equally important KPIs such as:
- On-time delivery – Percentage of the deliveries made on time.
- In-full delivery – Percentage of the deliveries made to the right address
- Damages – Percentage of the deliveries made with incurring any damages (Both to the goods / trucks / equipment used)
4) Cash to Cash Cycle
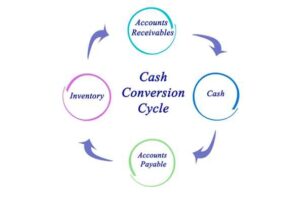
Although this particular KPI sounds like a factor that is completely financial it simply is the very core that will determine why and how an organization or a supply chain exists and will evolve. To further simplify – IT’S THE SIMPLEST MEASURE OF THE HEALTH OF THE ORGANISATION. While there quite a few formulae to calculate the ratio of this particular KPI, the simplest is the one which reveals the time consumed between the payment to the supplier (Raw Material Procurement) to Payment received from the end customers for the finished goods. THE SHORTER, THE BETTER!
For a Supply Chain this would simply mean – Time involved in procuring the material from the origin source (handling / transport) to the time involved in storing of the material (handling/ storage) to the time involved in dispatch and delivery of the goods (handling/ transport) to the end customer. Once again – THE SHORTER THE BETTER!
A large number of sub-sections can be involved in the Cash-to-Cash Cycle KPI.
To name a few:
- Cost vs Sales– Ratio of the Total Cost involved in Logistics vs the total value of the goods.
- Reverse Flow – Ratio of the Total Cost involved in Logistics vs the total value of goods returned.
- Demurrages – Ratio of the optimum billing cycle time of a unit volume of goods vs the billing cycle involving extended (unexpected) storage of goods.
- Damages – Ratio of the cost incurred during the supply chain due to damages pertaining to the handling / storage equipment, the transport trucks / vans or the goods itself to the actual profit margins on the goods.
How will the Industry 4.0 revolution change the supply chain? Read more here.